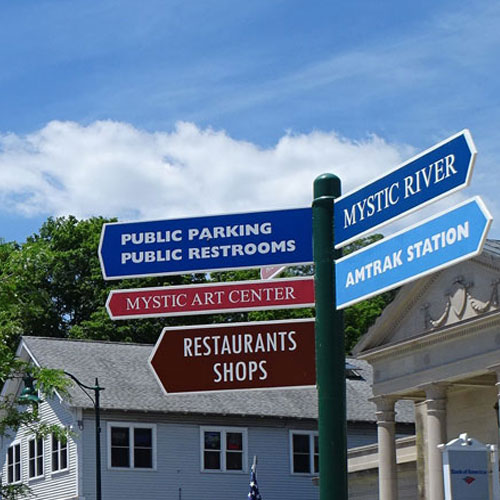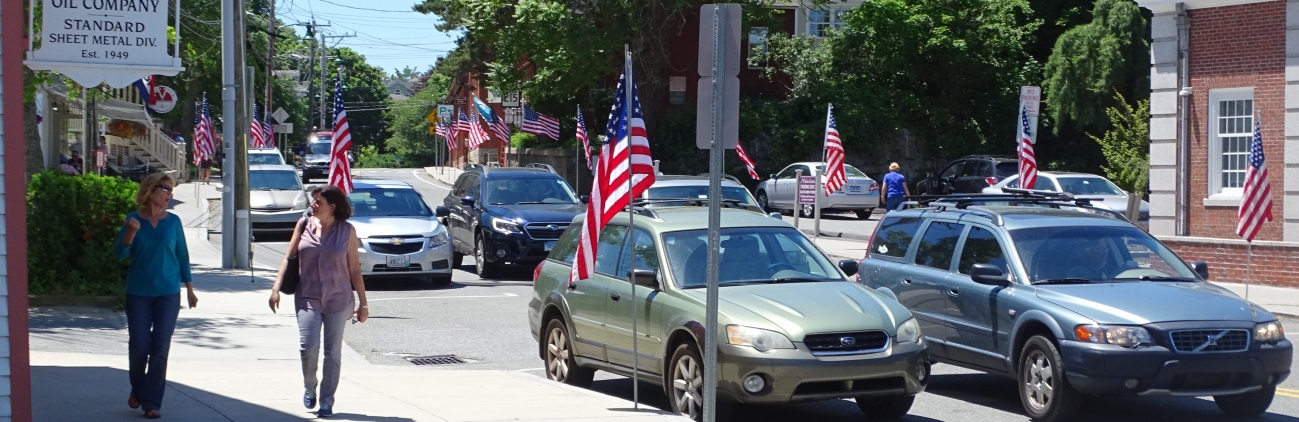
Groton
Additional Resources
More details about our community can be found in the Groton Town Profile. Another available resource is the Town's Interactive GIS Mapping.
Population
Back To Top
Population
| Population | 2000 | 2010 | 2023 | 2028 |
|---|---|---|---|---|
| Groton | 39,499 | 39,742 | 37,480 | 36,688 |
Source: ESRI, 2023-10-17
Population by Age
| Population | 2010 | 2023 | 2028 |
|---|---|---|---|
| 0-4 | 2,916 | 2,397 | 2,389 |
| 5-9 | 2,273 | 2,198 | 2,068 |
| 10-14 | 1,973 | 2,007 | 1,956 |
| 15-19 | 2,419 | 2,029 | 2,065 |
| 20-24 | 4,591 | 3,137 | 3,012 |
| 25-29 | 3,829 | 3,064 | 2,755 |
| 30-34 | 2,691 | 2,892 | 2,594 |
| 35-39 | 2,269 | 2,490 | 2,471 |
| 40-44 | 2,265 | 2,060 | 2,248 |
| 45-49 | 2,430 | 1,818 | 1,907 |
| 50-54 | 2,561 | 2,003 | 1,725 |
| 55-59 | 2,263 | 2,144 | 1,911 |
| 60-64 | 1,939 | 2,342 | 1,974 |
| 65-69 | 1,521 | 2,150 | 2,202 |
| 70-74 | 1,076 | 1,689 | 1,780 |
| 75-79 | 968 | 1,289 | 1,544 |
| 80-84 | 828 | 851 | 1,036 |
| 85+ | 929 | 921 | 1,052 |
| 18+ | 31,340 | 29,843 | 29,216 |
| Median Age | 34 | 37 | 38 |
Source: ESRI, 2023-10-17
Population by Race
| Groton | 2023 |
|---|---|
| Total | 37,480.00 |
| White Alone | 71.04 |
| Black Alone | 6.62 |
| American Indian Alone | 0.84 |
| Asian Alone | 5.70 |
| Pacific Islander Alone | 0.18 |
| Some Other Race | 4.95 |
| Two or More Races | 10.66 |
| Hispanic Origin | 12.97 |
| Diversity Index | 59.20 |
Source: ESRI, 2023-10-17
Growth Rate
| Groton | 2023 - 2028 |
|---|---|
| Population | -0.43% |
| Households | -0.08% |
| Families | -0.13% |
| Median Household Income | 2% |
| Per Capita Income | 2% |
Source: ESRI, 2023-10-17
Back To TopHousing
Back To Top
Households
| Population | 2000 | 2010 | 2023 | 2028 |
|---|---|---|---|---|
| Households | 15,368 | 15,717 | 16,119 | 16,052 |
| Housing Units | 16,714 | 17,873 | 18,182 | 18,013 |
| Owner Occupied Units | 7,953 | 8,069 | ||
| Renter Occupied Units | 8,166 | 7,983 | ||
| Vacant Units | 2,063 | 1,961 |
Source: ESRI, 2023-10-17
Home Value
| Groton | 2023 | 2028 |
|---|---|---|
| Median Home Value | $321,460 | $334,766 |
| Average Home Value | $365,741 | $383,099 |
| <$50,000 | 660 | 663 |
| $50,000 - $99,999 | 149 | 146 |
| $100,000 - $149,999 | 266 | 257 |
| $150,000 - $199,999 | 554 | 531 |
| $200,000 - $249,999 | 843 | 803 |
| $250,000 - $299,999 | 1,119 | 1,048 |
| $300,000 - $399,999 | 1,794 | 1,687 |
| $400,000 - $499,999 | 1,126 | 1,256 |
| $500,000 - $749,999 | 1,069 | 1,216 |
| $1,000,000 + | 61 | 73 |
Source: ESRI, 2023-10-17
Housing Year Built
| Year Range | Houses Built |
|---|---|
| 2010 or Later | 549 |
| 2000-2009 | 1,879 |
| 1990-1999 | 1,995 |
| 1980-1989 | 1,949 |
| 1970-1979 | 3,716 |
| 1960-1969 | 2,220 |
| 1950-1959 | 2,129 |
| 1940-1949 | 764 |
| 1939 or Before | 2,559 |
Source: ESRI, 2023-10-17
Back To TopIncome
Back To Top
Income
| Groton | 2023 | 2028 |
|---|---|---|
| Median Household | $75,100 | $81,236 |
| Average Household | $106,110 | $117,500 |
| Per Capita | $46,525 | $52,319 |
Source: ESRI, 2023-10-17
Household Income Base
| Groton | 2023 |
|---|---|
| <$15,000 | 1,018 |
| $15,000 - $24,999 | 1,003 |
| $25,000 - $34,999 | 1,896 |
| $35,000 - $49,999 | 1,549 |
| $50,000 - $74,999 | 2,582 |
| $75,000 - $99,999 | 2,130 |
| $100,000 - $149,999 | 2,985 |
| $150,000 - $199,999 | 1,442 |
| $200,000+ | 1,514 |
Source: ESRI, 2023-10-17
Back To TopEmployees
Back To Top
Commute
| Category | Commuters |
|---|---|
| Workers 16+ | 19,886 |
| In-County Residents | 17,822 |
| Out-of-County Residents | 1,077 |
| Drive Alone | 14,178 |
| Carpooled | 1,293 |
| Public Transport | 233 |
| Work at Home | 2,325 |
| Less than 5 minutes | 609 |
| 5-9 minutes | 2,981 |
| 10-14 minutes | 4,667 |
| 15-19 minutes | 3,733 |
| 20-24 minutes | 1,943 |
| 25-29 minutes | 734 |
| 30-34 minutes | 1,321 |
| 35-39 minutes | 125 |
| 40-44 minutes | 211 |
| 45-59 minutes | 444 |
| 60-89 minutes | 568 |
| 90+ minutes | 225 |
| Average Travel Time | 0 |
Source: ESRI, 2023-10-17
Source: ESRI, 2023-10-17
Employees by NAICS
| Category | Number |
|---|---|
| Total Employees | 25,657 |
| Agr/Forestry/Fish/Hunt | 10 |
| Mining | 49 |
| Utilities | 150 |
| Construction | 298 |
| Manufacturing | 10,248 |
| Wholesale Trade | 231 |
| Retail Trade | 1,822 |
| Motor Veh/Parts Dealers | 333 |
| Furn & Home Furnish Str | 17 |
| Electronics & Appl Store | 26 |
| Bldg Matl/Garden Equip | 53 |
| Food & Beverage Stores | 580 |
| Health/Pers Care Stores | 139 |
| Gasoline Stations | 36 |
| Clothing/Accessory Store | 88 |
| Sports/Hobby/Book/Music | 146 |
| General Merchandise Str | 403 |
| Misc Store Retailers | 0 |
| Nonstore Retailers | 0 |
| Transportation/Warehouse | 267 |
| Information | 268 |
| Finance & Insurance | 283 |
| Cntrl Bank/Crdt Intrmdtn | 168 |
| Sec/Cmdty Cntrct/Oth Inv | 59 |
| Insur/Funds/Trusts/Other | 56 |
| Real Estate/Rent/Leasing | 461 |
| Prof/Scientific/Tech Srv | 1,094 |
| Legal Services | 137 |
| Mgmt of Comp/Enterprises | 6 |
| Admin/Support/Waste Mgmt | 90 |
| Educational Services | 1,063 |
| HealthCare/Social Assist | 1,701 |
| Arts/Entertainment/Rec | 351 |
| Accommodation/Food Srvcs | 2,115 |
| Accommodation | 530 |
| Food Srv/Drinking Places | 1,585 |
| Other Srv excl Pub Admin | 1,078 |
| Auto Repair/Maintenance | 126 |
| Public Administration Emp | 3,999 |
Source: ESRI, 2023-10-17
Educational Attainment (25+)
| Groton | 2023 |
|---|---|
| Some High School | 846 |
| Graduated High School | 5,899 |
| Associates Degree | 2,136 |
| Bachelor's Degree | 5,786 |
| Graduate Degree | 4,660 |
Source: ESRI, 2023-10-17
Back To TopBusinesses
Back To Top
Businesses by NAICS
| Category | Number |
|---|---|
| Total Businesses | 1,430 |
| Agr/Forestry/Fish/Hunt Bus | 3 |
| Mining Bus | 3 |
| Utilities Bus | 1 |
| Construction Bus | 68 |
| Manufacturing Bus | 35 |
| Wholesale Trade Bus | 37 |
| Retail Trade Bus | 209 |
| Motor Veh/Parts Dealers Bus | 33 |
| Furn & Home Furnish Str Bus | 8 |
| Electronics & Appl Store Bus | 8 |
| Bldg Matl/Garden Equip Bus | 8 |
| Food & Beverage Stores Bus | 44 |
| Health/Pers Care Stores Bus | 20 |
| Gasoline Stations Bus | 9 |
| Clothing/Accessory Store Bus | 22 |
| Sports/Hobby/Book/Music Bus | 39 |
| General Merchandise Str Bus | 19 |
| Misc Store Retailers Bus | 0 |
| Nonstore Retailers Bus | 0 |
| Transportation/Warehouse Bus | 23 |
| Information Bus | 21 |
| Finance & Insurance Bus | 49 |
| Cntrl Bank/Crdt Intrmdtn Bus | 21 |
| Sec/Cmdty Cntrct/Oth Inv Bus | 17 |
| Insur/Funds/Trusts/Other Bus | 11 |
| Real Estate/Rent/Leasing Bus | 83 |
| Prof/Scientific/Tech Srv Bus | 127 |
| Legal Services Bus | 25 |
| Mgmt of Comp/Enterprises Bus | 3 |
| Admin/Support/Waste Mgmt Bus | 33 |
| Educational Services Bus | 31 |
| HealthCare/Social Assist Bus | 149 |
| Arts/Entertainment/Rec Bus | 54 |
| Accommodation/Food Srvcs Bus | 151 |
| Accommodation Bus | 24 |
| Food Srv/Drinking Places Bus | 127 |
| Other Srv excl Pub Admin Bus | 183 |
| Auto Repair/Maintenance Bus | 21 |
| Public Administration Bus | 69 |
Source: ESRI, 2023-10-17
Back To Top